Table Visualization Options
Using Tables
For data sources that support a native query syntax (SQL or NOSQL), you can choose your data return format, which columns to return, and in what order by modifying your query. But sources like CSV files or Google Sheets don’t support a query syntax. So DataReporter allows you to manually reorder, hide, and format data in your table visualizations.
Info: If you absolutely depend on a feature of SQL, you can use the Query Results Data Source to post-process your data.
Visualization Settings
To get started, click the Edit Visualization button under the table view. A settings panel appears that looks like this:
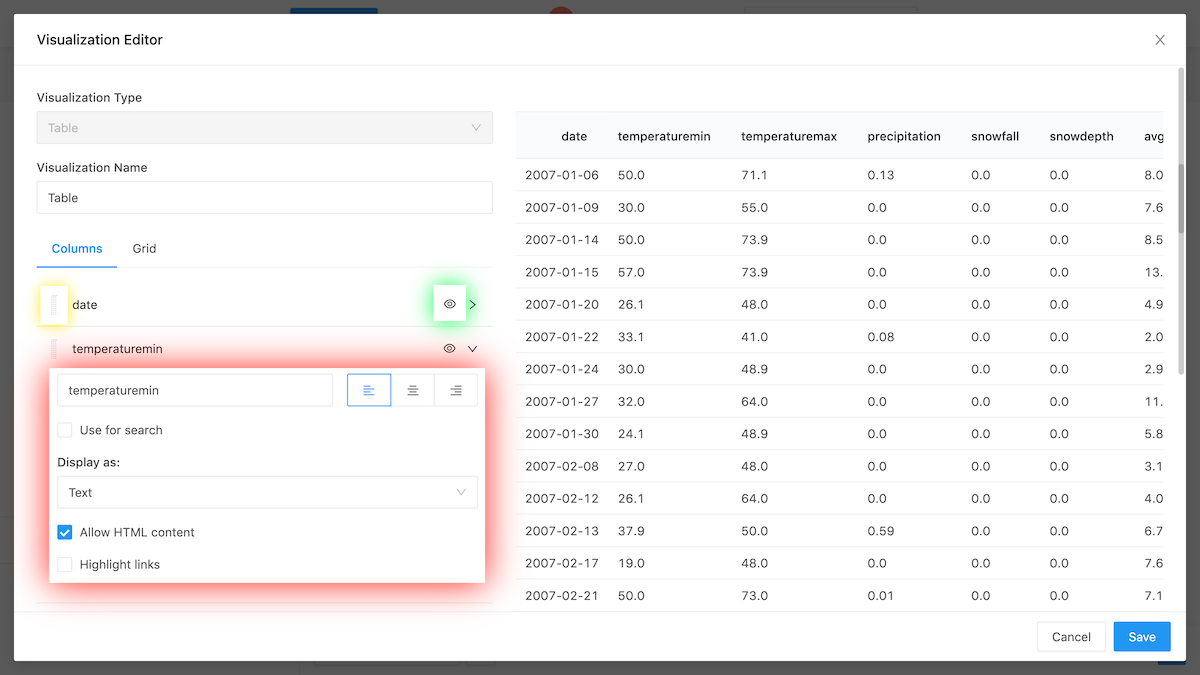
You can:
- Reorder Columns by dragging them to the left or right as shown in the yellow highlight.
- Hide Columns by toggling the check mark highlighted in green
- Format Columns using the format settings highlighted red. Read more about column formatting below.
Formatting Columns
DataReporter is sensitive to the data types that are common to most databases: text, numbers, dates and booleans. But it also has special support for non-standard column types like JSON documents, images, and links.
Info: DataReporter sanitizes HTML in query results. But if any HTML tags remain they are not escaped by default. Thus you may see odd effects if a query result includes string fields that include HTML (e.g. from a web scraper). Toggle the Allow HTML content setting in the visualization editor to escape HTML characters.
Common Data Types
DataReporter will render a column as text if your underlying data source does not provide type information. But you can force it to use arbitrary types using the table visualization editor. This is especially useful for sources like SQLite, Google Sheets, or CSV files where type data is not available. You can, for example:
- Display all floats out to three decimal places
- Show only the month and year of a date column
- Zero-pad all integers
- Prepend or Append text to your number fields
A full reference for rendering numbers in DataReporter is available here. You can read about how to format dates here.
Special Data Types
DataReporter also supports data types outside the common database specifications.
-
JSON Documents
If you’re underlying data returns JSON formatted text in a field, you can instruct DataReporter to display it as such. This lets you collapse and expand elements in a clean format. This is particularly useful when querying RESTful APIs with the [JSON Data Source]({% link _kb/data-sources/querying/urls %})
-
Images
If a field in your database contains links to an image, DataReporter can display that image inline with your table results. This is especially useful for dashboards.
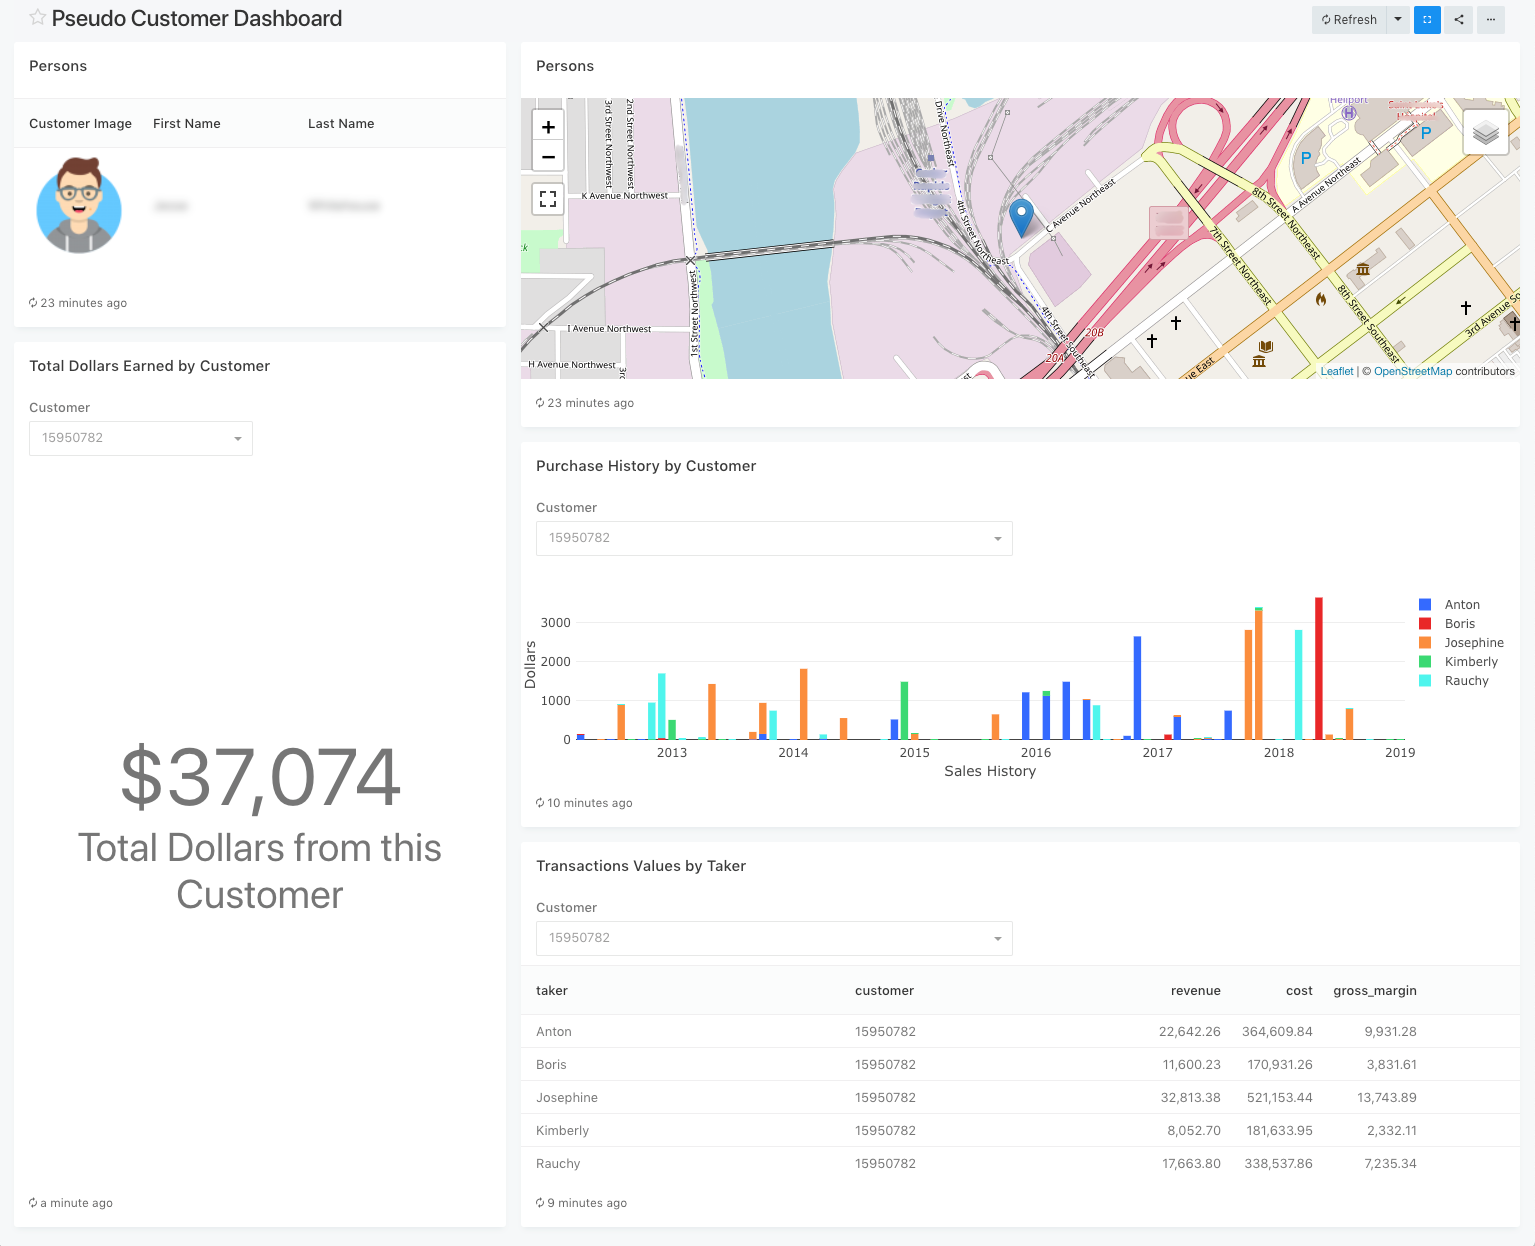
In the above dashboard, the Customer Image field is a URL to a picture which DataReporter displays in-place.
-
HTML Links
Just like with images, HTML links from your DB can be made clickable in DataReporter. Just use the Link option in the column format selector.